
What’s Wrong with the MTA B Line?
Overview
The New York City subway system is the most extensive in the Western Hemisphere. It moves millions of passengers daily between nearly 500 different stations. It is also highly complex, with lines that feature both local and express service, constantly changing service patterns, and frequent merges and splits with other lines.
As a result, not all lines are created equal. Services like the 7 or L trains run relatively on time, thanks to structural advantages like few merging conflicts and modern signaling infrastructure. And then…there’s the B line, which has none of that. If we look at key performance metrics released by NYC Transit, we see that the B is one of the worst performing lines in the system:
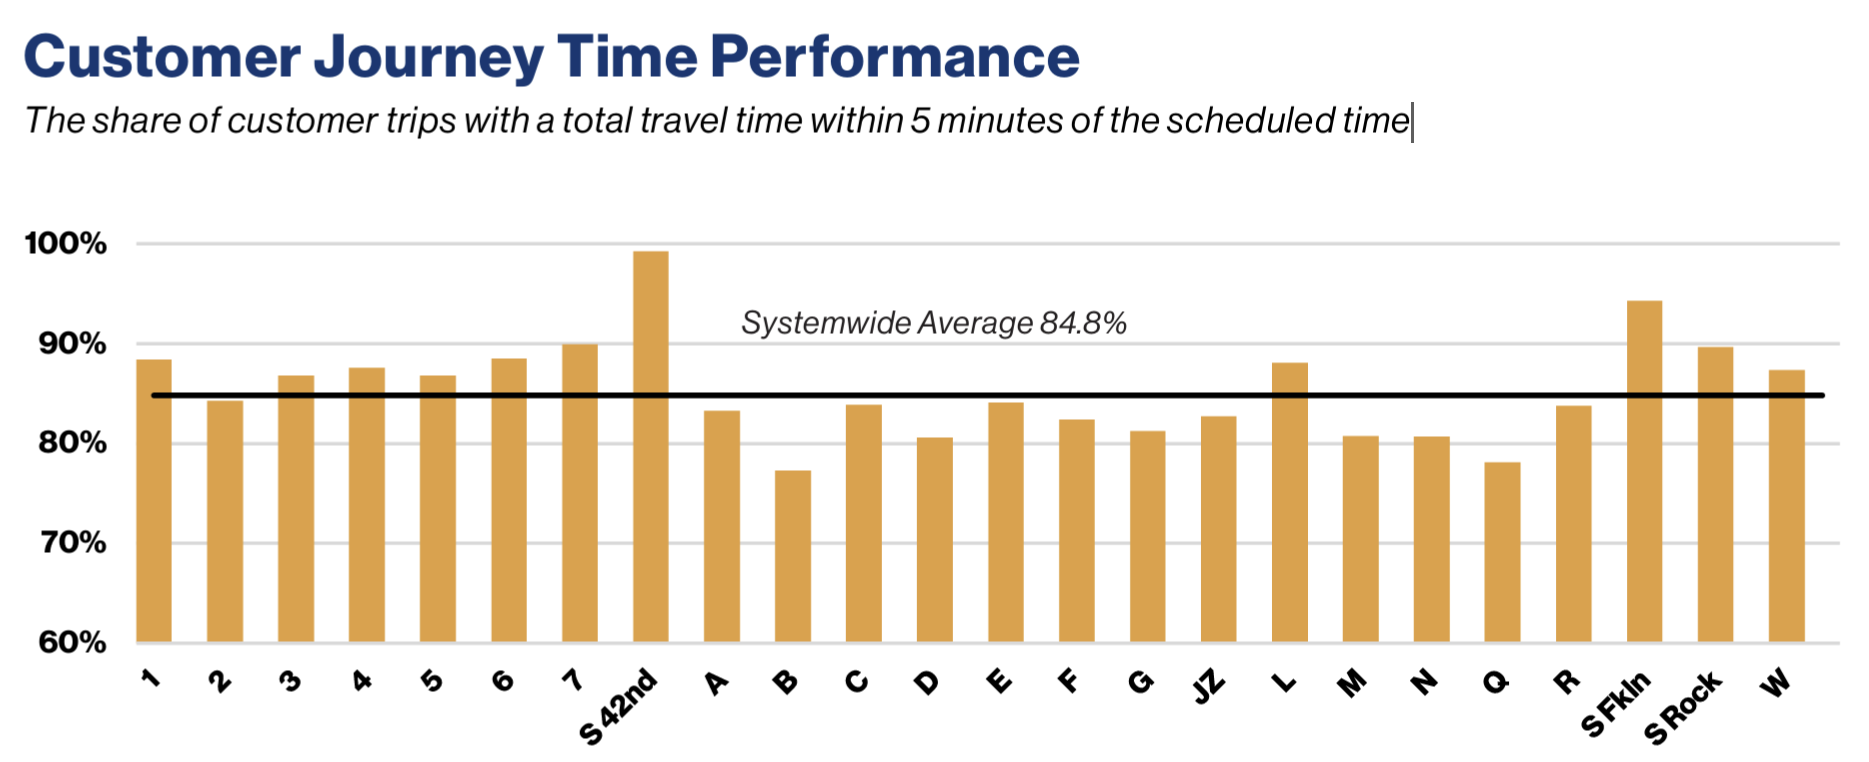
What makes this line so bad? And, more practically, what can be done to improve its performance? These are hard questions that transit advocates and planners have thought through in much more detail than I have. But data provides an important source of ground truth that can inform these conversations and allow people to make the best use of limited funds and political will. And in recent years, as consistent funding for the MTA has emerged and provided real opportunities to improve the system, a principled approach towards data analysis is more important than ever.
Here, I take a first stab at the problem by using publicly available data to identify high-level trends in B line performance over the past couple of years. Based on those trends, I weigh the merits of existing conversations on signal modernization and deinterlining proposals to see if the data supports the claims.
Data sources
To investigate this problem, I pulled from four publicly available datasets from the New York State Open Data portal:
- MTA Subway End-to-End Running Times: Beginning 2019
- MTA Subway Trains Delayed: Beginning 2020
- MTA Subway Schedules: 2024
- MTA Subway Schedules: 2025
For the scope of this analysis, I filtered the data to focus only on data from the B line, and I focused on a time period from 2024 to 2025. I then built a SQLite database to hold the relevant data for quick retrieval and EDA down the line.
Schedule changes affect performance
I found that the best way to understand performance trends during this time period is through studying changes in planned service. As a quick review, here’s a map of typical B line operation:
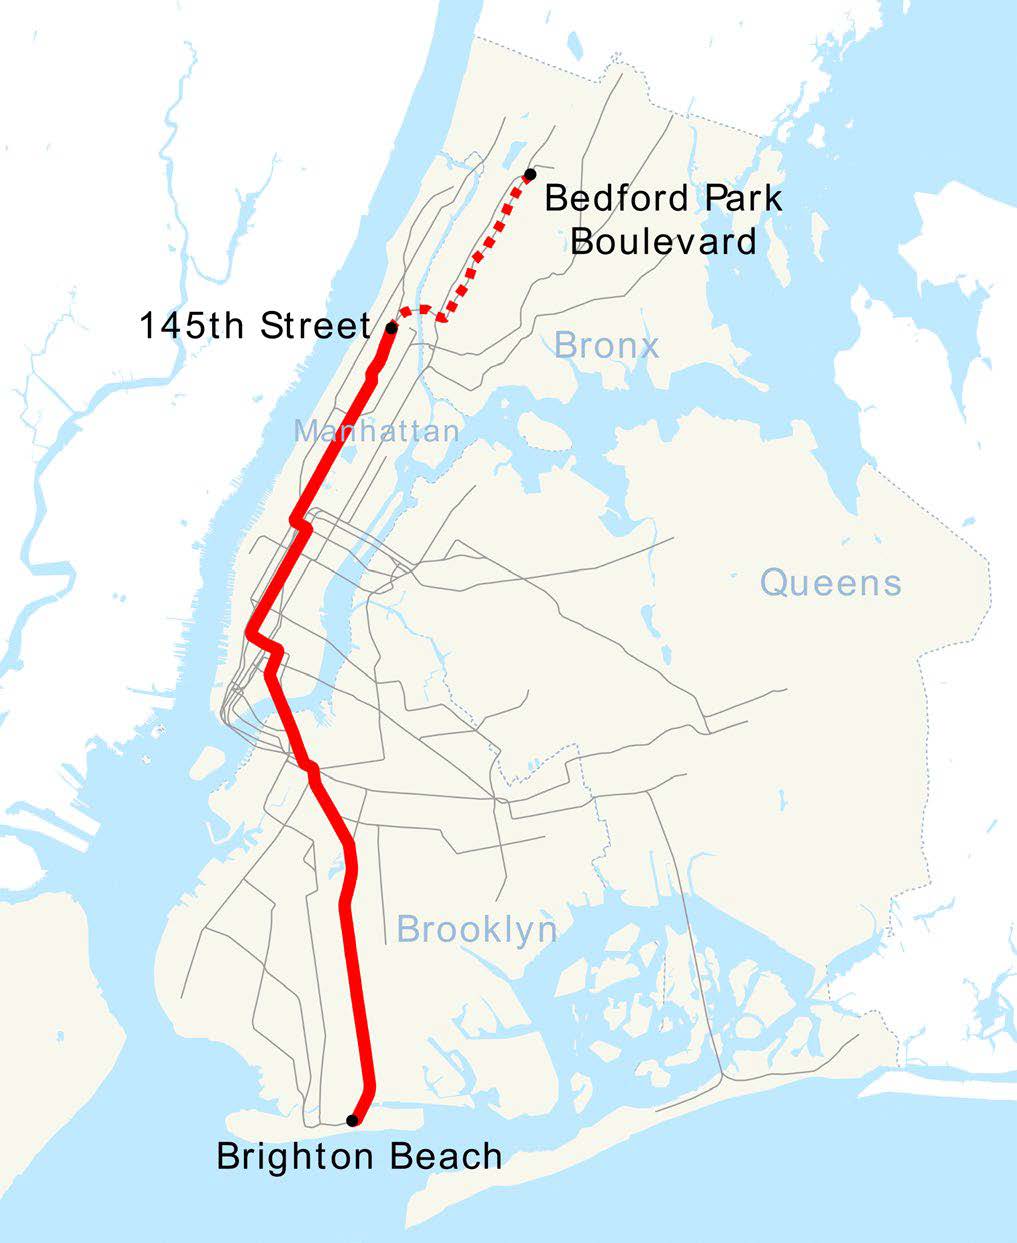
Starting from the south, trains experience express service along the Brighton Beach line up to Prospect Park, before continuing with local service into Manhattan all the way up to the 145 St station. From there, trains either short turn (i.e., turn around) or continue northwards into the Bronx before terminating at Bedford Park Blvd.
2024-2025 saw two major changes in this general behavior:
- Modified (increased local) service along the Brighton Beach line from Aug 2024 – Feb 2025, related to planned ROW work
- Increased midday service starting July 2024, and introducing select midday service into the Bronx:
- 6 tph (trains per hour) → 8 tph each direction
- In the Bronx: 0 tph → 4 tph each direction
These two changes divide the 2024 – 2025 study period into three distinct time periods that we will use to contextualize the trends we see later:
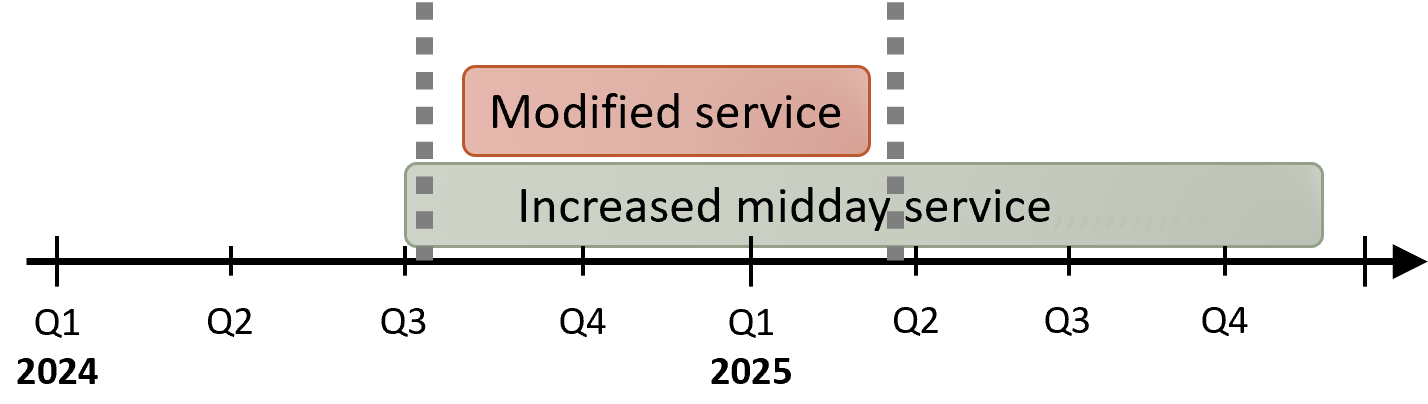
The first period (early 2024) represents baseline operation. That’s followed by a period featuring the modified local service pattern along the Brighton Beach line, continuing into early 2025. Finally, the third period (most of 2025) saw a return to baseline service patterns but with increased train frequencies.
A common performance metric is called “On-time Performance” (OTP), defined by the percentage of scheduled trains that are not delayed (or, worse, fail to run altogether). If we look at OTP on the B line during each of our three time periods, we clearly see the metric respond with the underlying service changes:
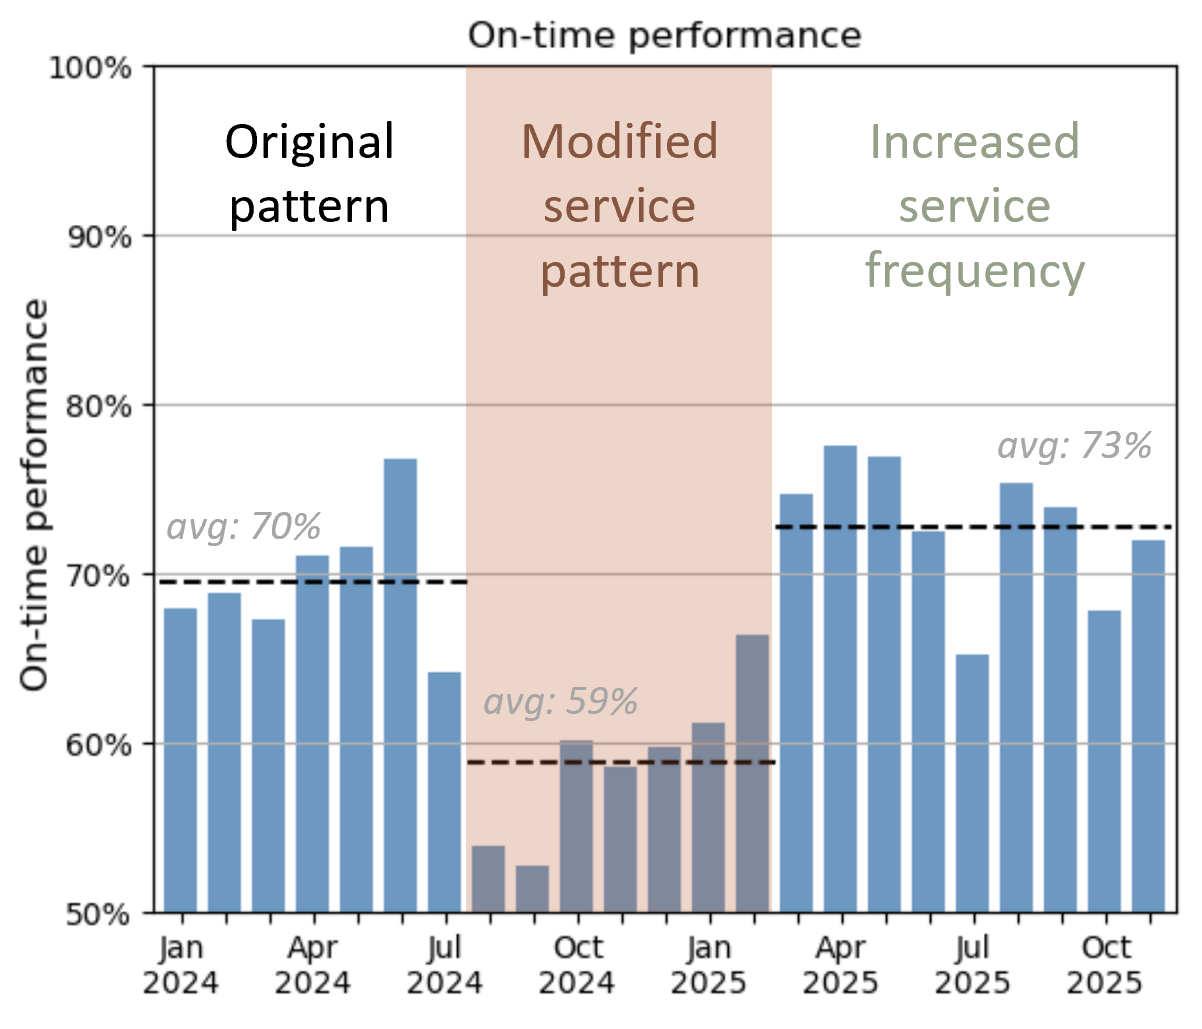
When the MTA introduced local service in mid 2024, OTP dropped sharply from an average of 70% to values in the low 50s in July and August, before stabilizing to a slightly higher average of 59% during this time period. This drop isn’t so surprising, actually: the modified service patterns were in response to planned ROW work on the line, which naturally lead to service disruptions during that work.
What’s interesting is that, after resuming normal service patterns, OTP not only fully recovered but even slightly increased to an average of 73% during the third time period, even though the service frequency increased. Naively, you might expect that increasing the number of trains would lead to more delays as the line becomes more congested. Apparently, that is not the case here.
Infrastructure is the dominant root cause of delays
That said, an on-time performance of 73% is still not stellar. To shed light on the remaining issues, I took a look at the breakdown of delay reports on the B line by root cause category, which I displayed by month in this stacked area plot:
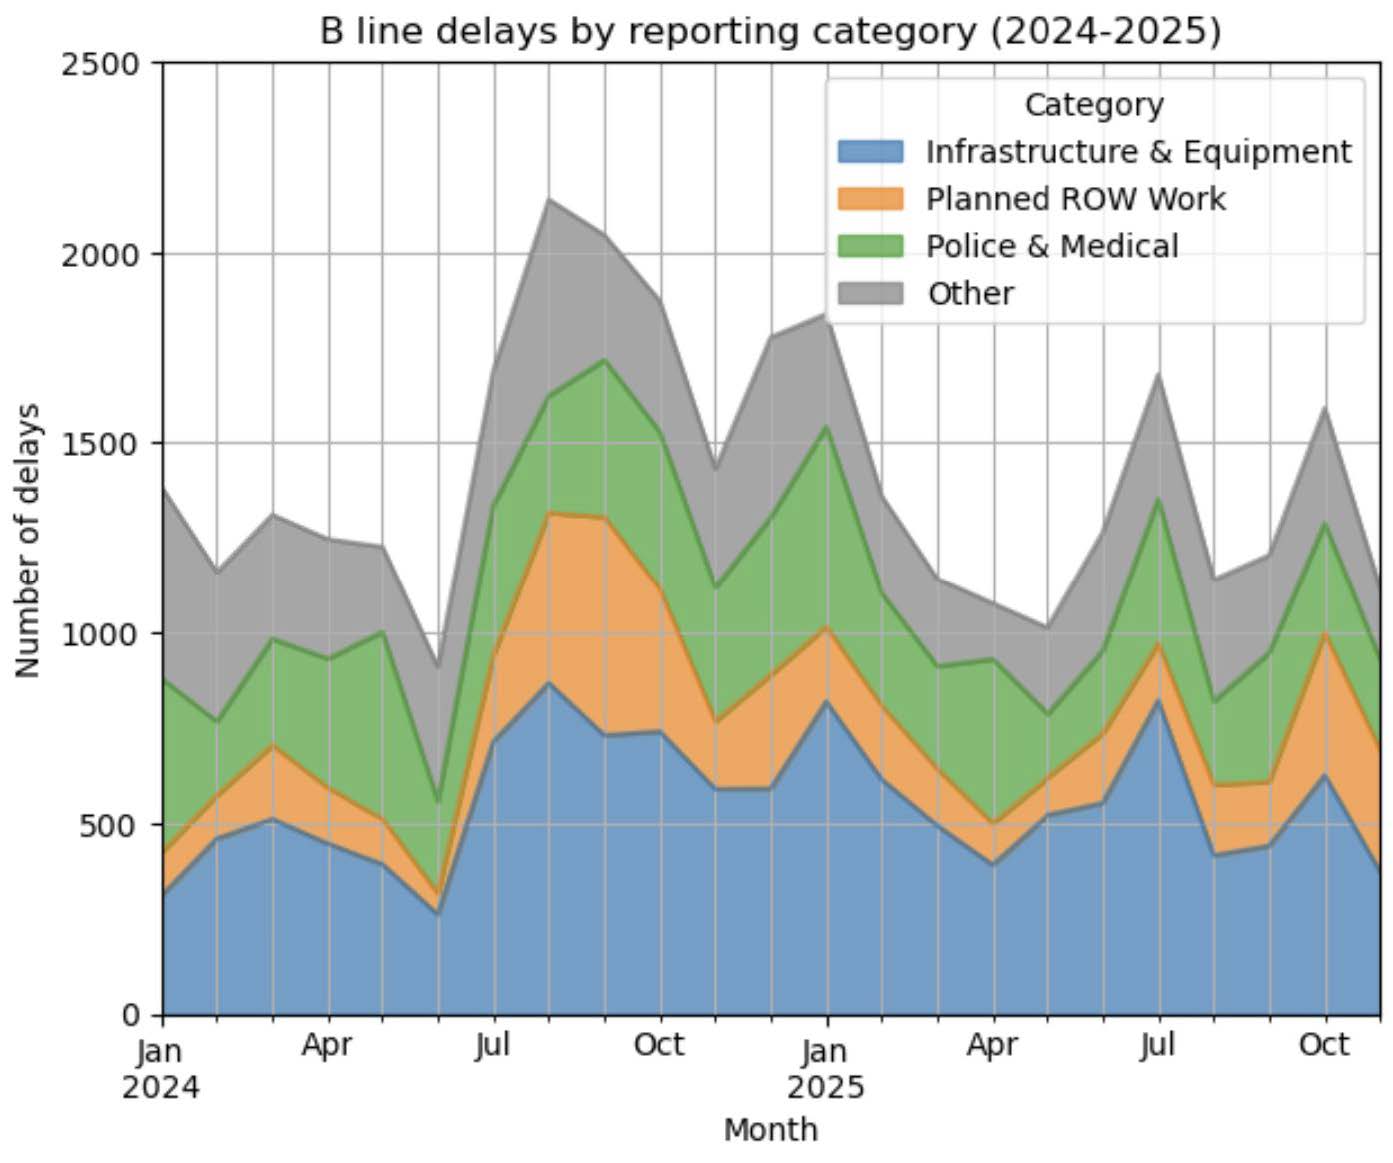
From this plot, the Infrastructure & Equipment (I&E) category stands out as a substantial contributor of delays. This category includes failures due to physical systems like signals, track, train cars, and the stations themselves. It’s no secret that much of the subway’s infrastructure is aging beyond its usable life, and evidently the problem is substantial: month to month, I&E consistently makes up 35-40% of all delays on the line, much larger than any other category and making I&E a limiting factor for improvement.
On top of the I&E delays, we see several transient spikes in the delay count. Most notable is in mid-2024, which featured a large increase in delays. This lines up with the drop in on-time performance we saw in the last section. We had attributed that to delays induced by planned ROW work on the line, and sure enough, we see here that a spike in that category (orange) explains the increase in delays. This breakdown also shows why OTP was able to rebound afterwards: after planned ROW work was completed, its associated delays dropped back down to a low baseline.
Improvements are driven by smarter scheduling
What the above data doesn’t show us is a clear signal about why OTP might have slightly improved in 2025. To better understand the mechanism behind this change, I looked directly at end-to-end train running times data.
There, I saw something interesting: on average, trains on the B line run several minutes behind their scheduled time (northbound trains, at least). That lag time decreased from 2024 to 2025, but much of that change was driven by adjustments to the schedule, rather than shorter actual runtimes. For example, take a look at the running times for northbound evening service to 145 St:
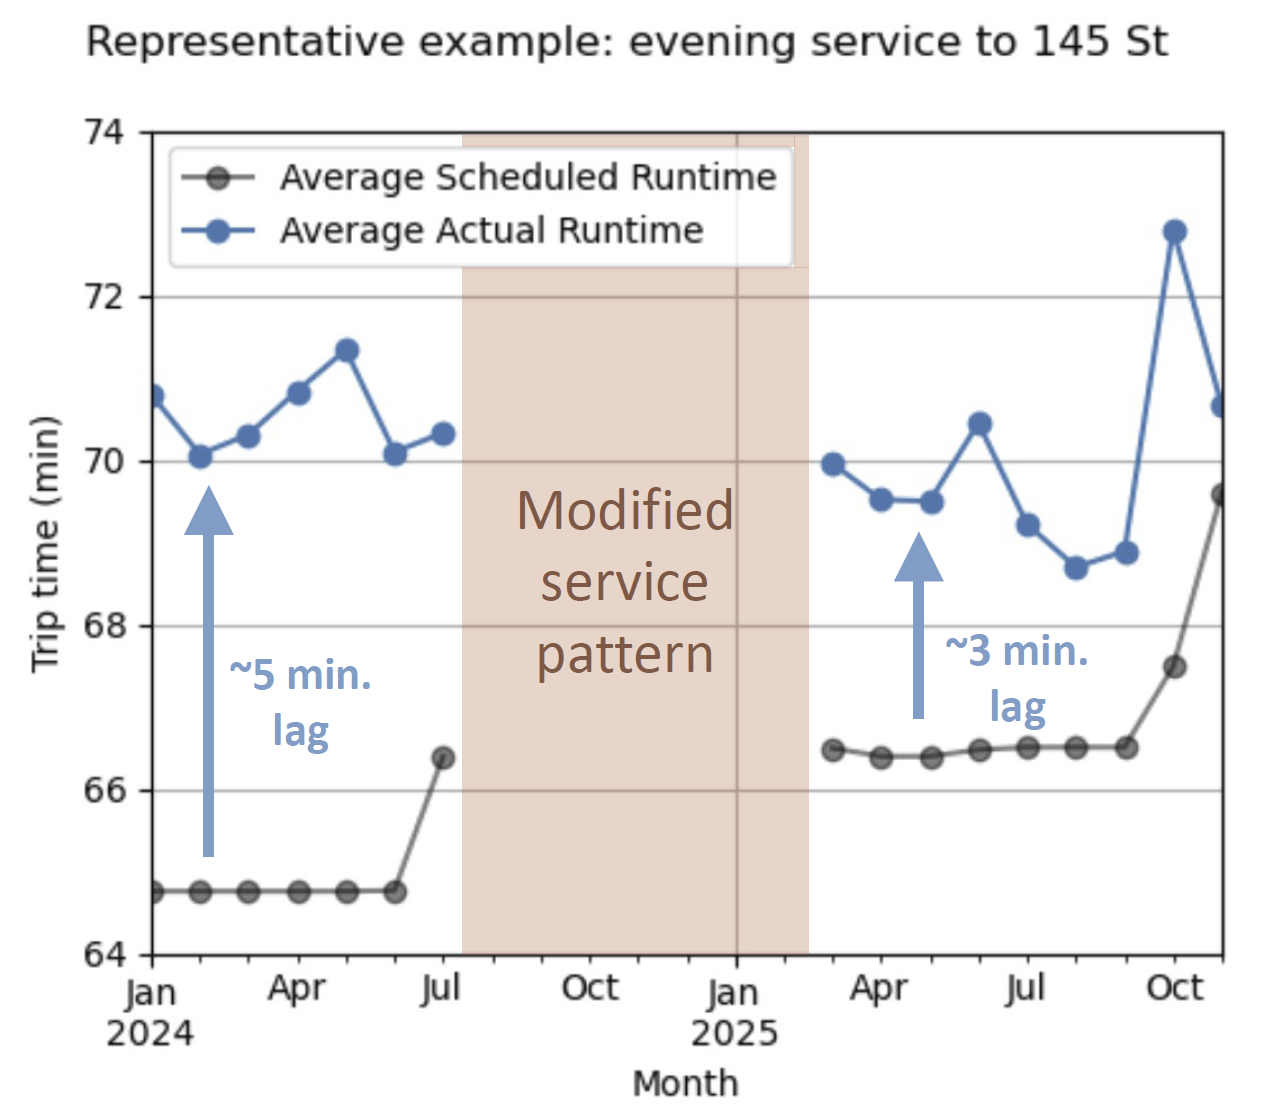
In early 2024, the actual running time lagged behind the schedule by about 5 minutes on average. But an adjustment upwards in the scheduled running time caused this gap to shrink down to about 3 minutes in 2025 (ignoring the spike in October-November 2025, which I’ll not get into). There was also a gradual decrease in the actual running time as well, but that decrease is less stark.
In some ways, this change is good and helpful to subway riders: the timetables now provide a better idea of when trains will actually arrive, on average. This isn’t the full picture, however. Although the average running time is better predicted, there is still signficant variability in running times from trip to trip, with the fastest trips taking 4-6 minutes less time than the slowest trips on multiple service patterns:
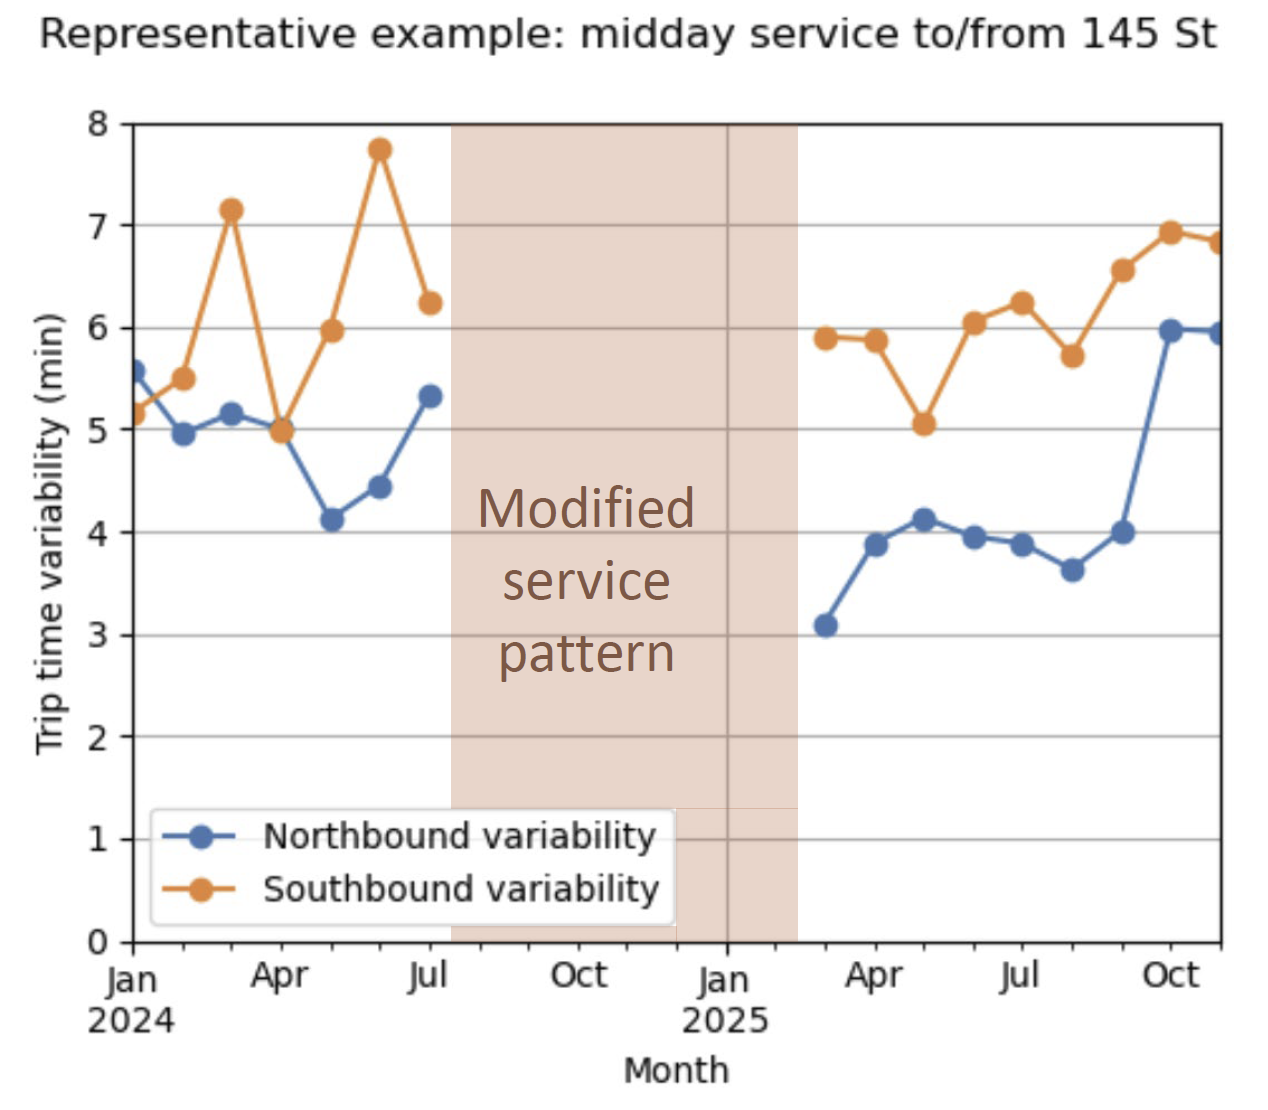
For midday service plotted above, northbound service showed a slight (~1 minute) improvement from 2024 to 2025. However, this improvement was not replicated with southbound service, which remained high. Generally across all service patterns, I didn’t notice a consistent reduction in trip time variability in the same way I noticed a clear improvement in average times.
Why is this a problem? First of all, it directly hurts OTP metrics, since high variability increases the fraction of trains that run far enough behind schedule to be considered delayed. It also impacts subway riders much more than a predictable lag in the trains: if passengers want to ensure they’ll arrive at their destination on time with high probability, they’ll have to budget for this 4-6 minute variation between trips in their itinerary (or more, depending on how long the tail is in the train time distribution).
Summary and recommendations
From this analysis, I’ve gathered three main takeaways about B line performance:
- Smart scheduling has contributed to modest improvements in on-time performance.
- However, variability between train running times remains high, making trips unpredictable.
- Infrastructure is consistently the dominant underlying issue for delays and missed trips.
This tells us that replacing and upgrading aging infrastructure should be a high priority. Transit advocates and planners have been pushing for various infrastructure upgrades on the system, and luckily, there are a couple of planned efforts that directly affect the B line. Thanks to funding provided by congestion pricing, signal modernization is planned in the near future along the BDFM 6th Avenue line, including installation of communications-based train control (CBTC) infrastructure. Additionally, the MTA is purchasing new rolling stock to replace cars in the B Division aging beyond their usable life. Together, these upgrades have the potential to limit unexpected stops, increase headways, and decrease train crowding, which should substantially reduce infrastructure-related delays.
Delays can also propagate from other lines onto the B line at key interlining junctions such as the DeKalb interlocking. With the available data, I wasn’t able to analyze station-level granularity on delay information to check how much DeKalb contributes to delays or trip time variability on the line. However, the MTA is actively considering “deinterlining” DeKalb (rerouting services to different tracks in order to minimize merge conflicts) to enable 6 Av signal modernization without interfering with other merging services (in particular, the N and Q trains). If this change occurs, it will be interesting to see how it improves (or doesn’t improve) performance.